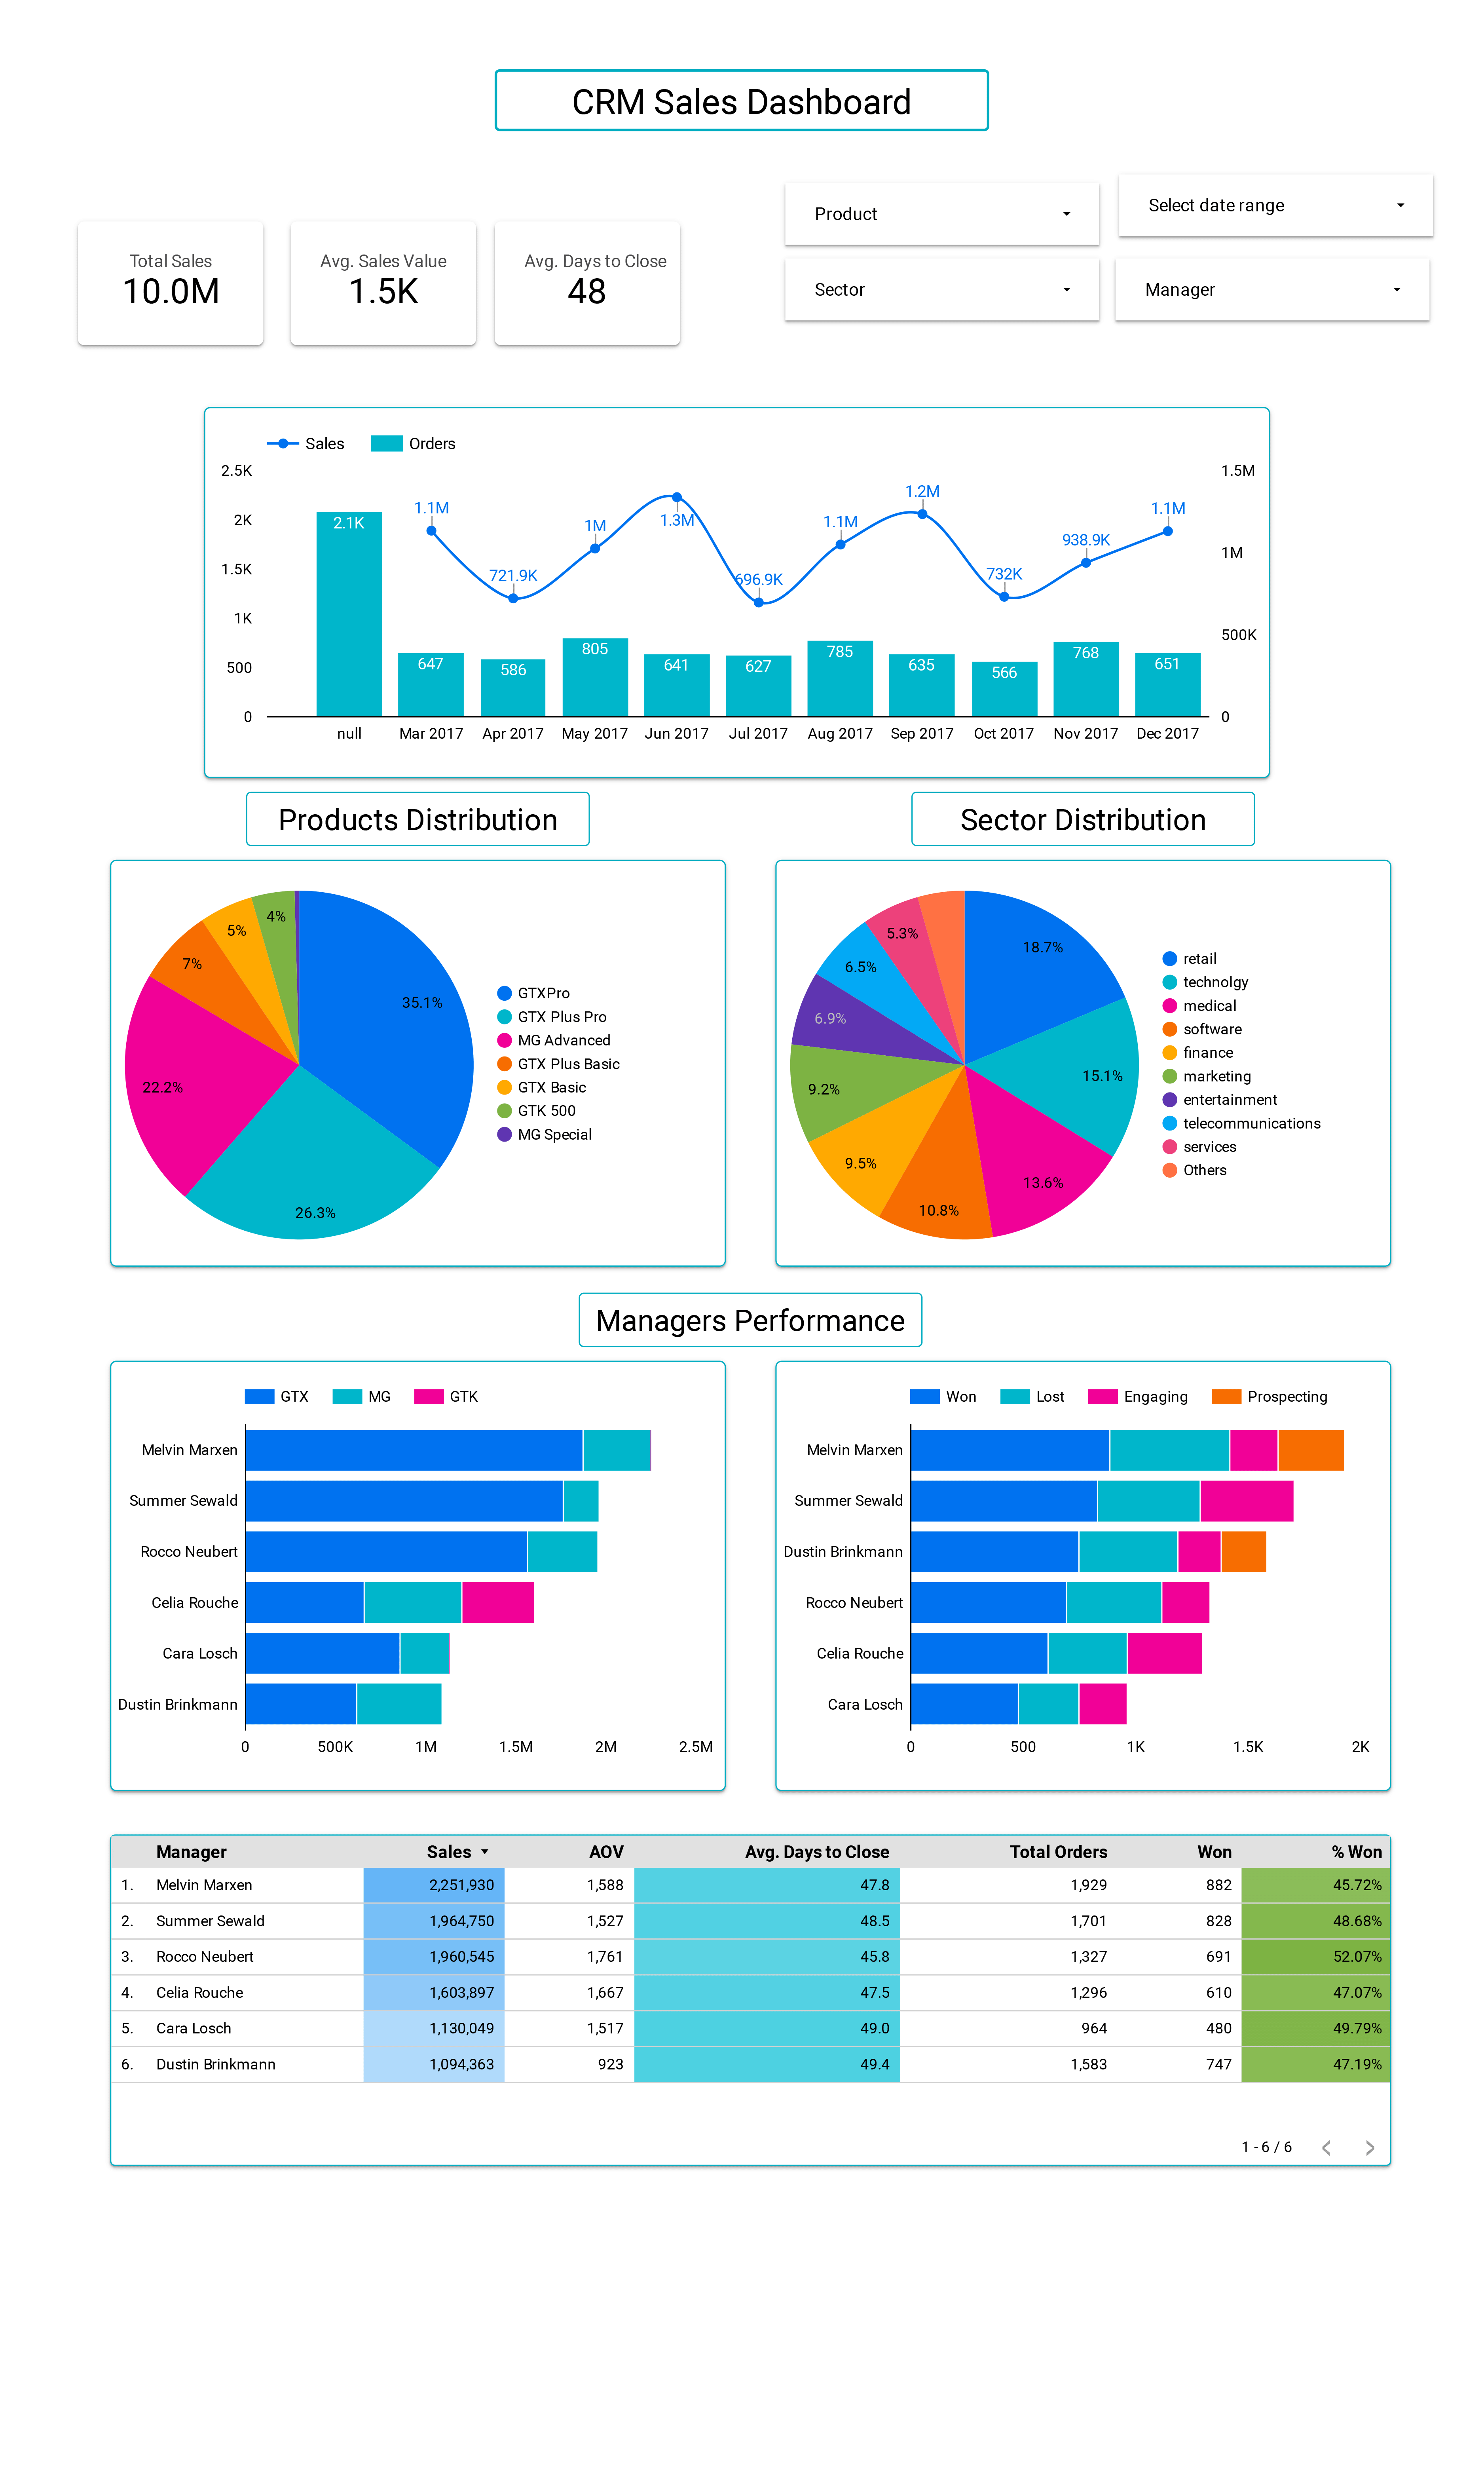
This Data Studio (formerly Looker Studio) dashboard was the live-dashboard project in the Data Analytics Bootcamp at Human Development Network Bangladesh (HDNB), used to teach students how to build a live dashboard from CRM sales data. It shows 10.0M in total sales, an average sales value of 1.5K and 48 average days to close. It splits the results by month, product, sector and sales manager, and compares the six managers on sales, win rate and time to close.
Teaching project, Data Analytics Bootcamp at HDNB (2024)
Dataset
Sample CRM sales opportunities for six sales managers, with products, sectors and deal stages
Time window
Monthly view from March to December 2017, plus a bucket of orders with no month
Scale
10.0M total sales and 8,800 orders in the manager table, of which 4,238 are won
Filters
Product, date range, sector, manager
Stack
BigQuery, SQL, Google Sheets and Data Studio
Why it was built
From May to August 2024 I taught SQL in the Data Analytics Bootcamp run by HDNB, from database basics through window functions and query tuning, ending with how to create and manage live dashboards. This dashboard was the course project for that last part: students used it to learn how CRM opportunity records turn into scorecards, trends, mix charts and a manager comparison that update as the data changes.
The data is a sample CRM dataset used for teaching, so the figures below show what the dashboard surfaces, not a real company's results.
What the dashboard contains
Three scorecards (total sales, average sales value, average days to close) sit above a monthly chart of sales against orders. Two pie charts show the product and sector mix. A manager section has two stacked bar charts, one by product family (GTX, MG, GTK) and one by deal stage, and a table with sales, average order value (AOV), average days to close, total orders, orders won and win rate for each manager.
What the dashboard shows
Monthly sales and orders. Monthly sales run from 696.9K in July to 1.3M in June, and monthly orders from 566 in October to 805 in May. The two do not move together: June has the highest sales on 641 orders, while May has the most orders and 1M in sales. A further 2.1K orders sit in a "null" month bucket.
Product mix. GTXPro has the largest share at 35.1%, then GTX Plus Pro at 26.3% and MG Advanced at 22.2%. GTX Plus Basic, GTX Basic and GTK 500 are 7%, 5% and 4%.
Sector mix. Retail is largest at 18.7%, then technology at 15.1% and medical at 13.6%. Software, finance and marketing are each between 9.2% and 10.8%.
Managers. Across the six managers, 4,238 of 8,800 orders are won, which is 48.2%. The table below shows the spread.
Manager performance table (names are from the sample dataset)
Manager
Sales
AOV
Avg. days to close
Orders
Won
Win rate
Melvin Marxen
2,251,930
1,588
47.8
1,929
882
45.72%
Summer Sewald
1,964,750
1,527
48.5
1,701
828
48.68%
Rocco Neubert
1,960,545
1,761
45.8
1,327
691
52.07%
Celia Rouche
1,603,897
1,667
47.5
1,296
610
47.07%
Cara Losch
1,130,049
1,517
49.0
964
480
49.79%
Dustin Brinkmann
1,094,363
923
49.4
1,583
747
47.19%
Melvin Marxen has the highest sales and the lowest win rate of the six. Rocco Neubert has the highest win rate (52.07%), the highest AOV (1,761) and the fastest average close (45.8 days). Dustin Brinkmann has the lowest AOV (923) on 1,583 orders. The manager sales add up to 10,005,534, matching the 10.0M scorecard.
Questions
Which sales manager has the highest win rate in the CRM dashboard?
Rocco Neubert, at 52.07% (691 of 1,327 orders), followed by Cara Losch at 49.79%. The highest total sales belong to Melvin Marxen at 2,251,930, whose win rate of 45.72% is the lowest of the six.
What is the average days to close in this CRM dashboard?
48 days overall. Per manager it ranges from 45.8 days (Rocco Neubert) to 49.4 days (Dustin Brinkmann).
Is the data in this CRM dashboard from a real company?
No. It is a sample CRM dataset used to teach live dashboard building in a data analytics bootcamp. The numbers show what the dashboard can surface, not a company's results.