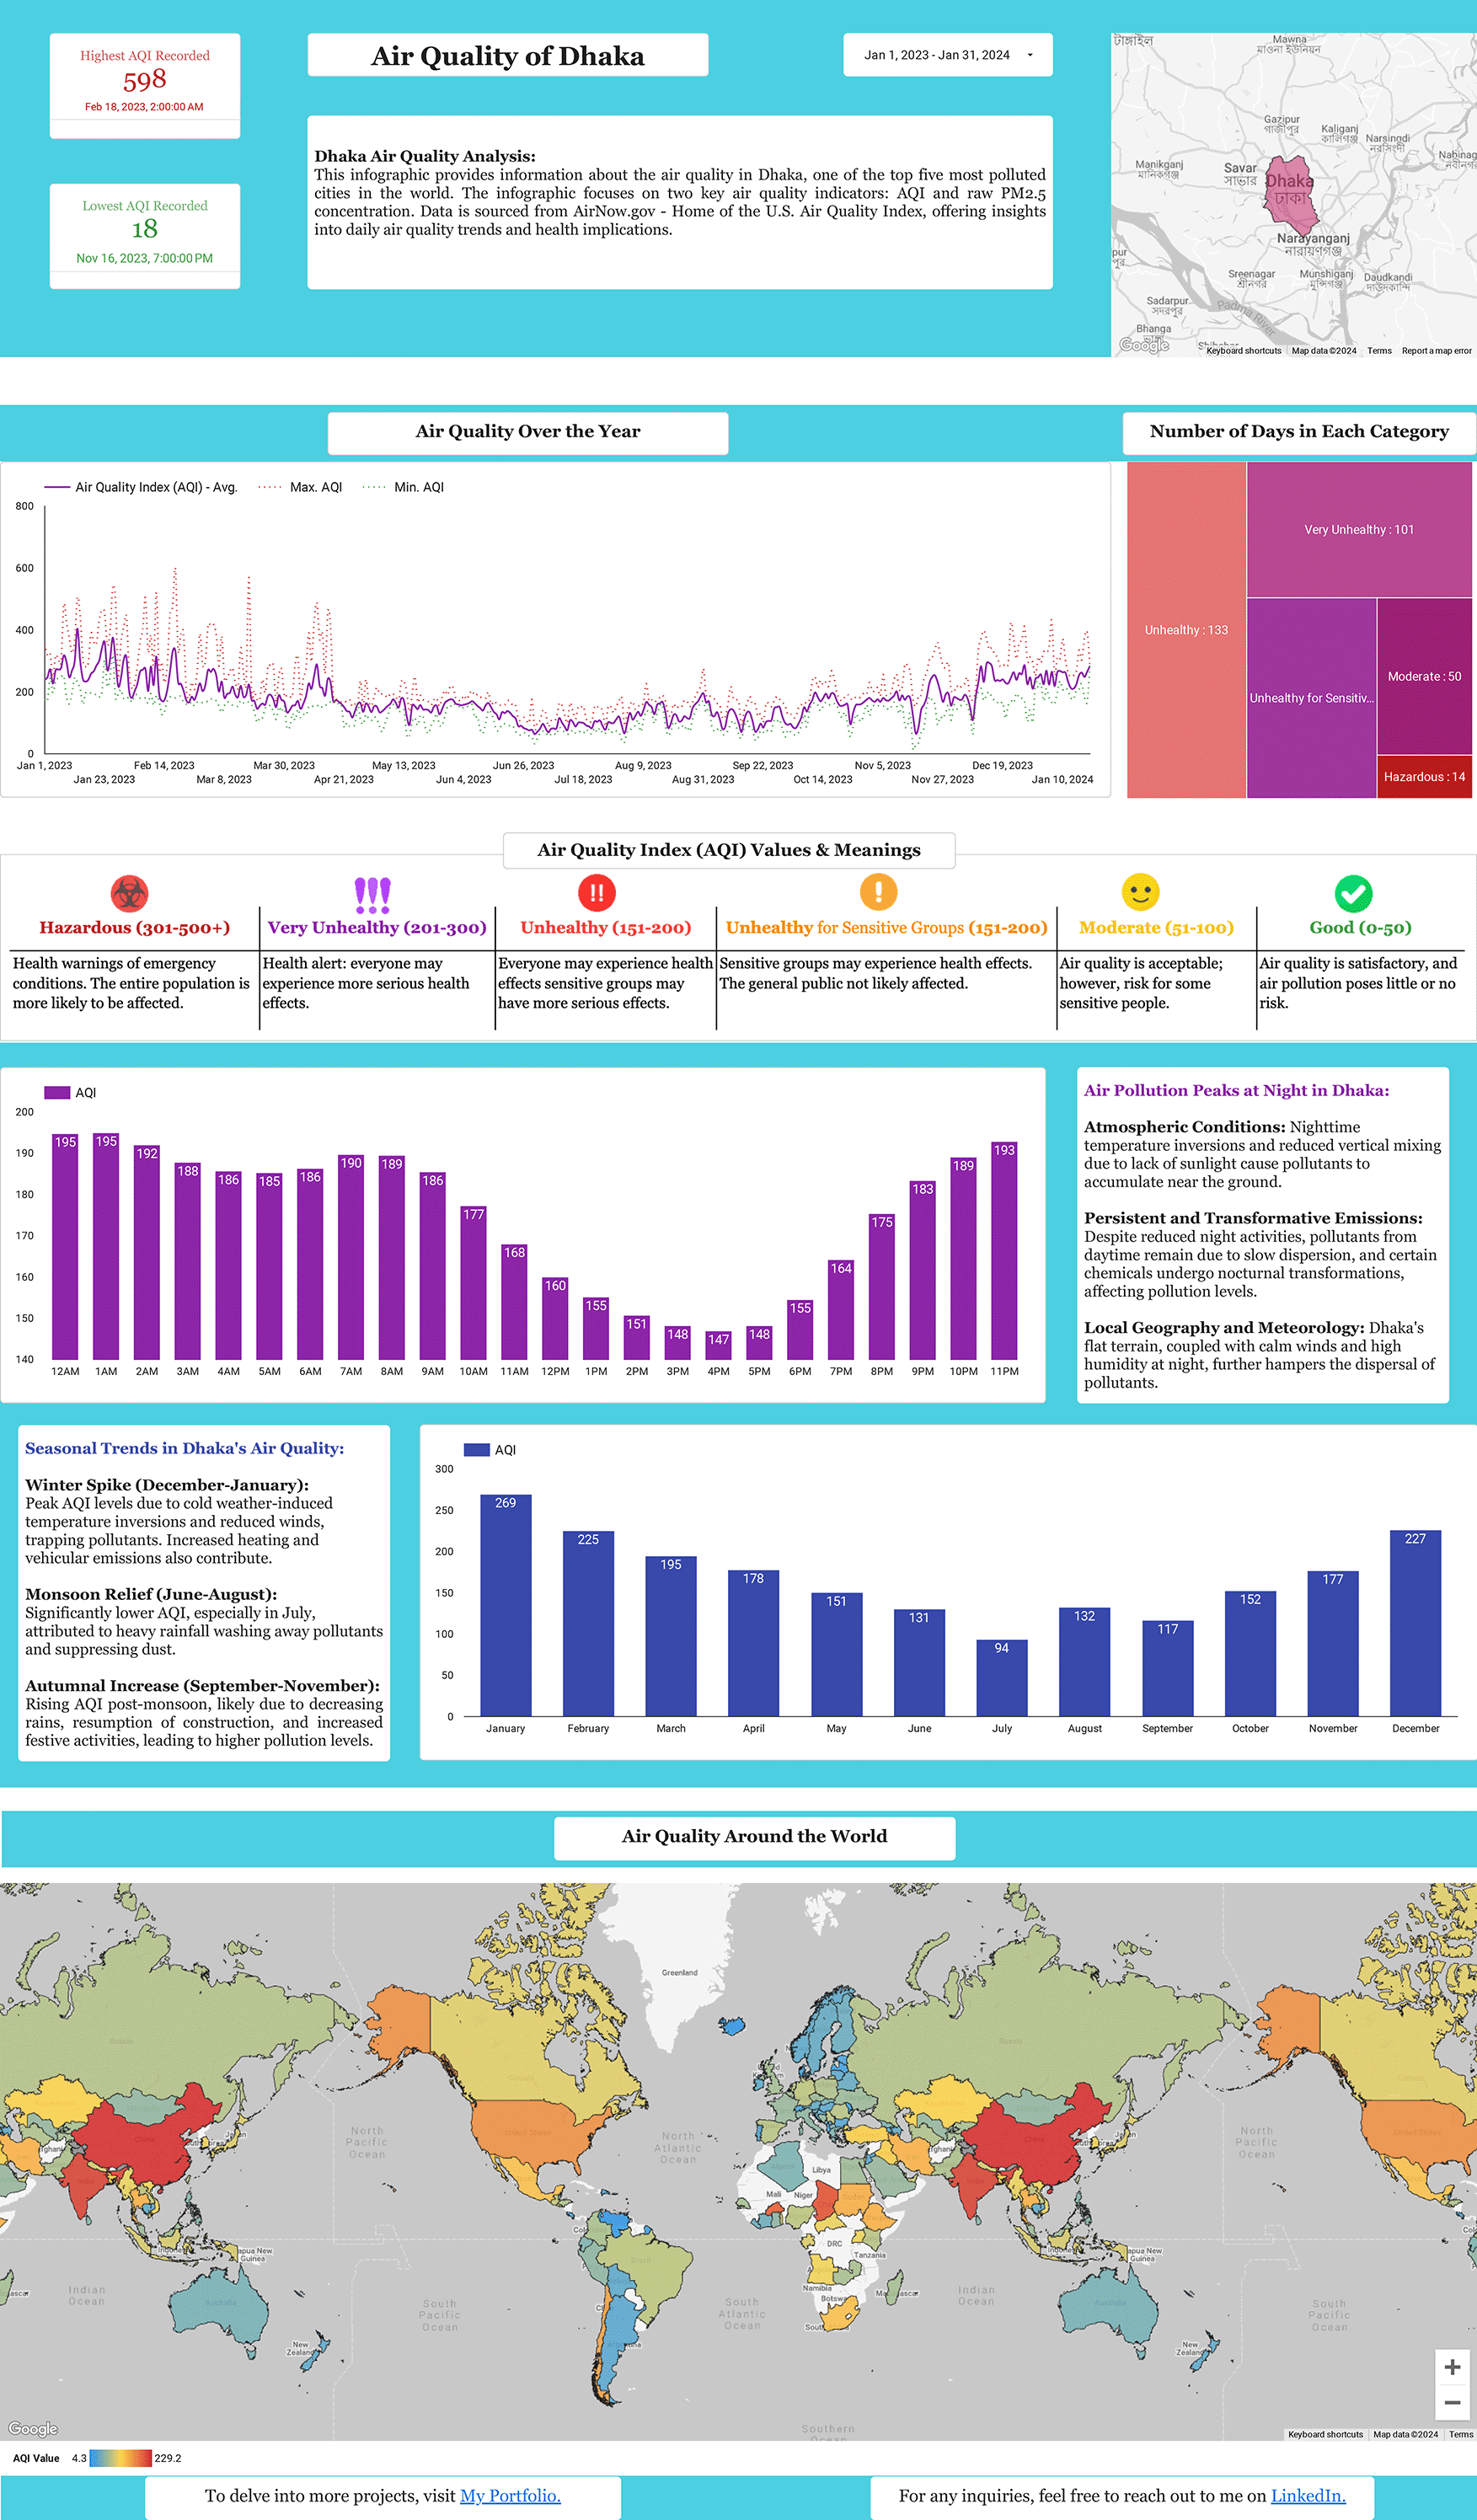
Air Quality of Dhaka
📊 Explore my latest dashboard for an in-depth analysis of Dhaka's air quality, currently
holding the rank as the most polluted city in the globe 🌏.
Historically recognized as one of the most pollution-burdened cities, Dhaka confronts severe
environmental hurdles. This detailed analysis brings to
light the severity of the circumstances, with a startling peak AQI of 598 in 2023 😷.
Here are some key takeaways from the data:
▶ The dashboard tracks the AQI from 2020 to the present, highlighting times when air quality
reached to 'Very Unhealthy' and 'Hazardous' levels 🔴.
▶ Dhaka endured 133 'Unhealthy' days, a distressing 82 'Very Unhealthy' days, 18 'Hazardous'
days, and notably, not a single 'Good' air quality day 🚫🌿, emphasizing the persistent air
quality crisis.
▶ A seasonal breakdown shows a winter surge in pollutants and a monsoon phase that offers a
brief window of cleaner air🌦️.
▶ The data also sheds light on nighttime pollution peaks, influenced by specific atmospheric
conditions and continuous emissions. 🌃💨.
Comparing Dhaka's AQI on a global scale underscores the critical need for immediate action.
- Google BigQuery
- SQL
- Looker Studio