AI Agent Development
I build multi-model AI agents using RAG pipelines, LangGraph, and hybrid vector search — ready to plug into your product and scale with your users.

I turn messy data into systems that move revenue and inform decisions. Over 4+ years across EdTech and SaaS, I've built everything from BigQuery ETL pipelines and Looker Studio dashboards to production RAG agents using LangGraph and hybrid vector search.production At 10 Minute School, I contributed to a $5.5M pre-Series A and helped architect USAID's education data infrastructure across Bangladesh. Outside work, I research - my ML paper is published in Hindawi's BioMed Research International.indexed
Read CVTurning raw data into decisions — and building the AI systems that make it scale.— Niloy
Available for freelance & consulting projects
I build multi-model AI agents using RAG pipelines, LangGraph, and hybrid vector search — ready to plug into your product and scale with your users.
I model your lead funnel, score prospects, and run A/B tests—then architect the stack behind them: ETL pipelines, BigQuery warehouses, and executive dashboards built for where your business is headed.
I design and optimise data pipelines and build dashboards across Looker Studio, Tableau, and Metabase that streamline decisions across product and operations.
A rolling inventory of tools, languages, and systems I reach for every day — paused on hover.

Tools & Technology used - Python, Google BigQuery, SQL, Google Data
Studio, Airbyte
Delivered hands-on instruction in Python for data analysis and introductory machine learning to contribute to SheSTEM’s mission of empowering female STEM graduates.
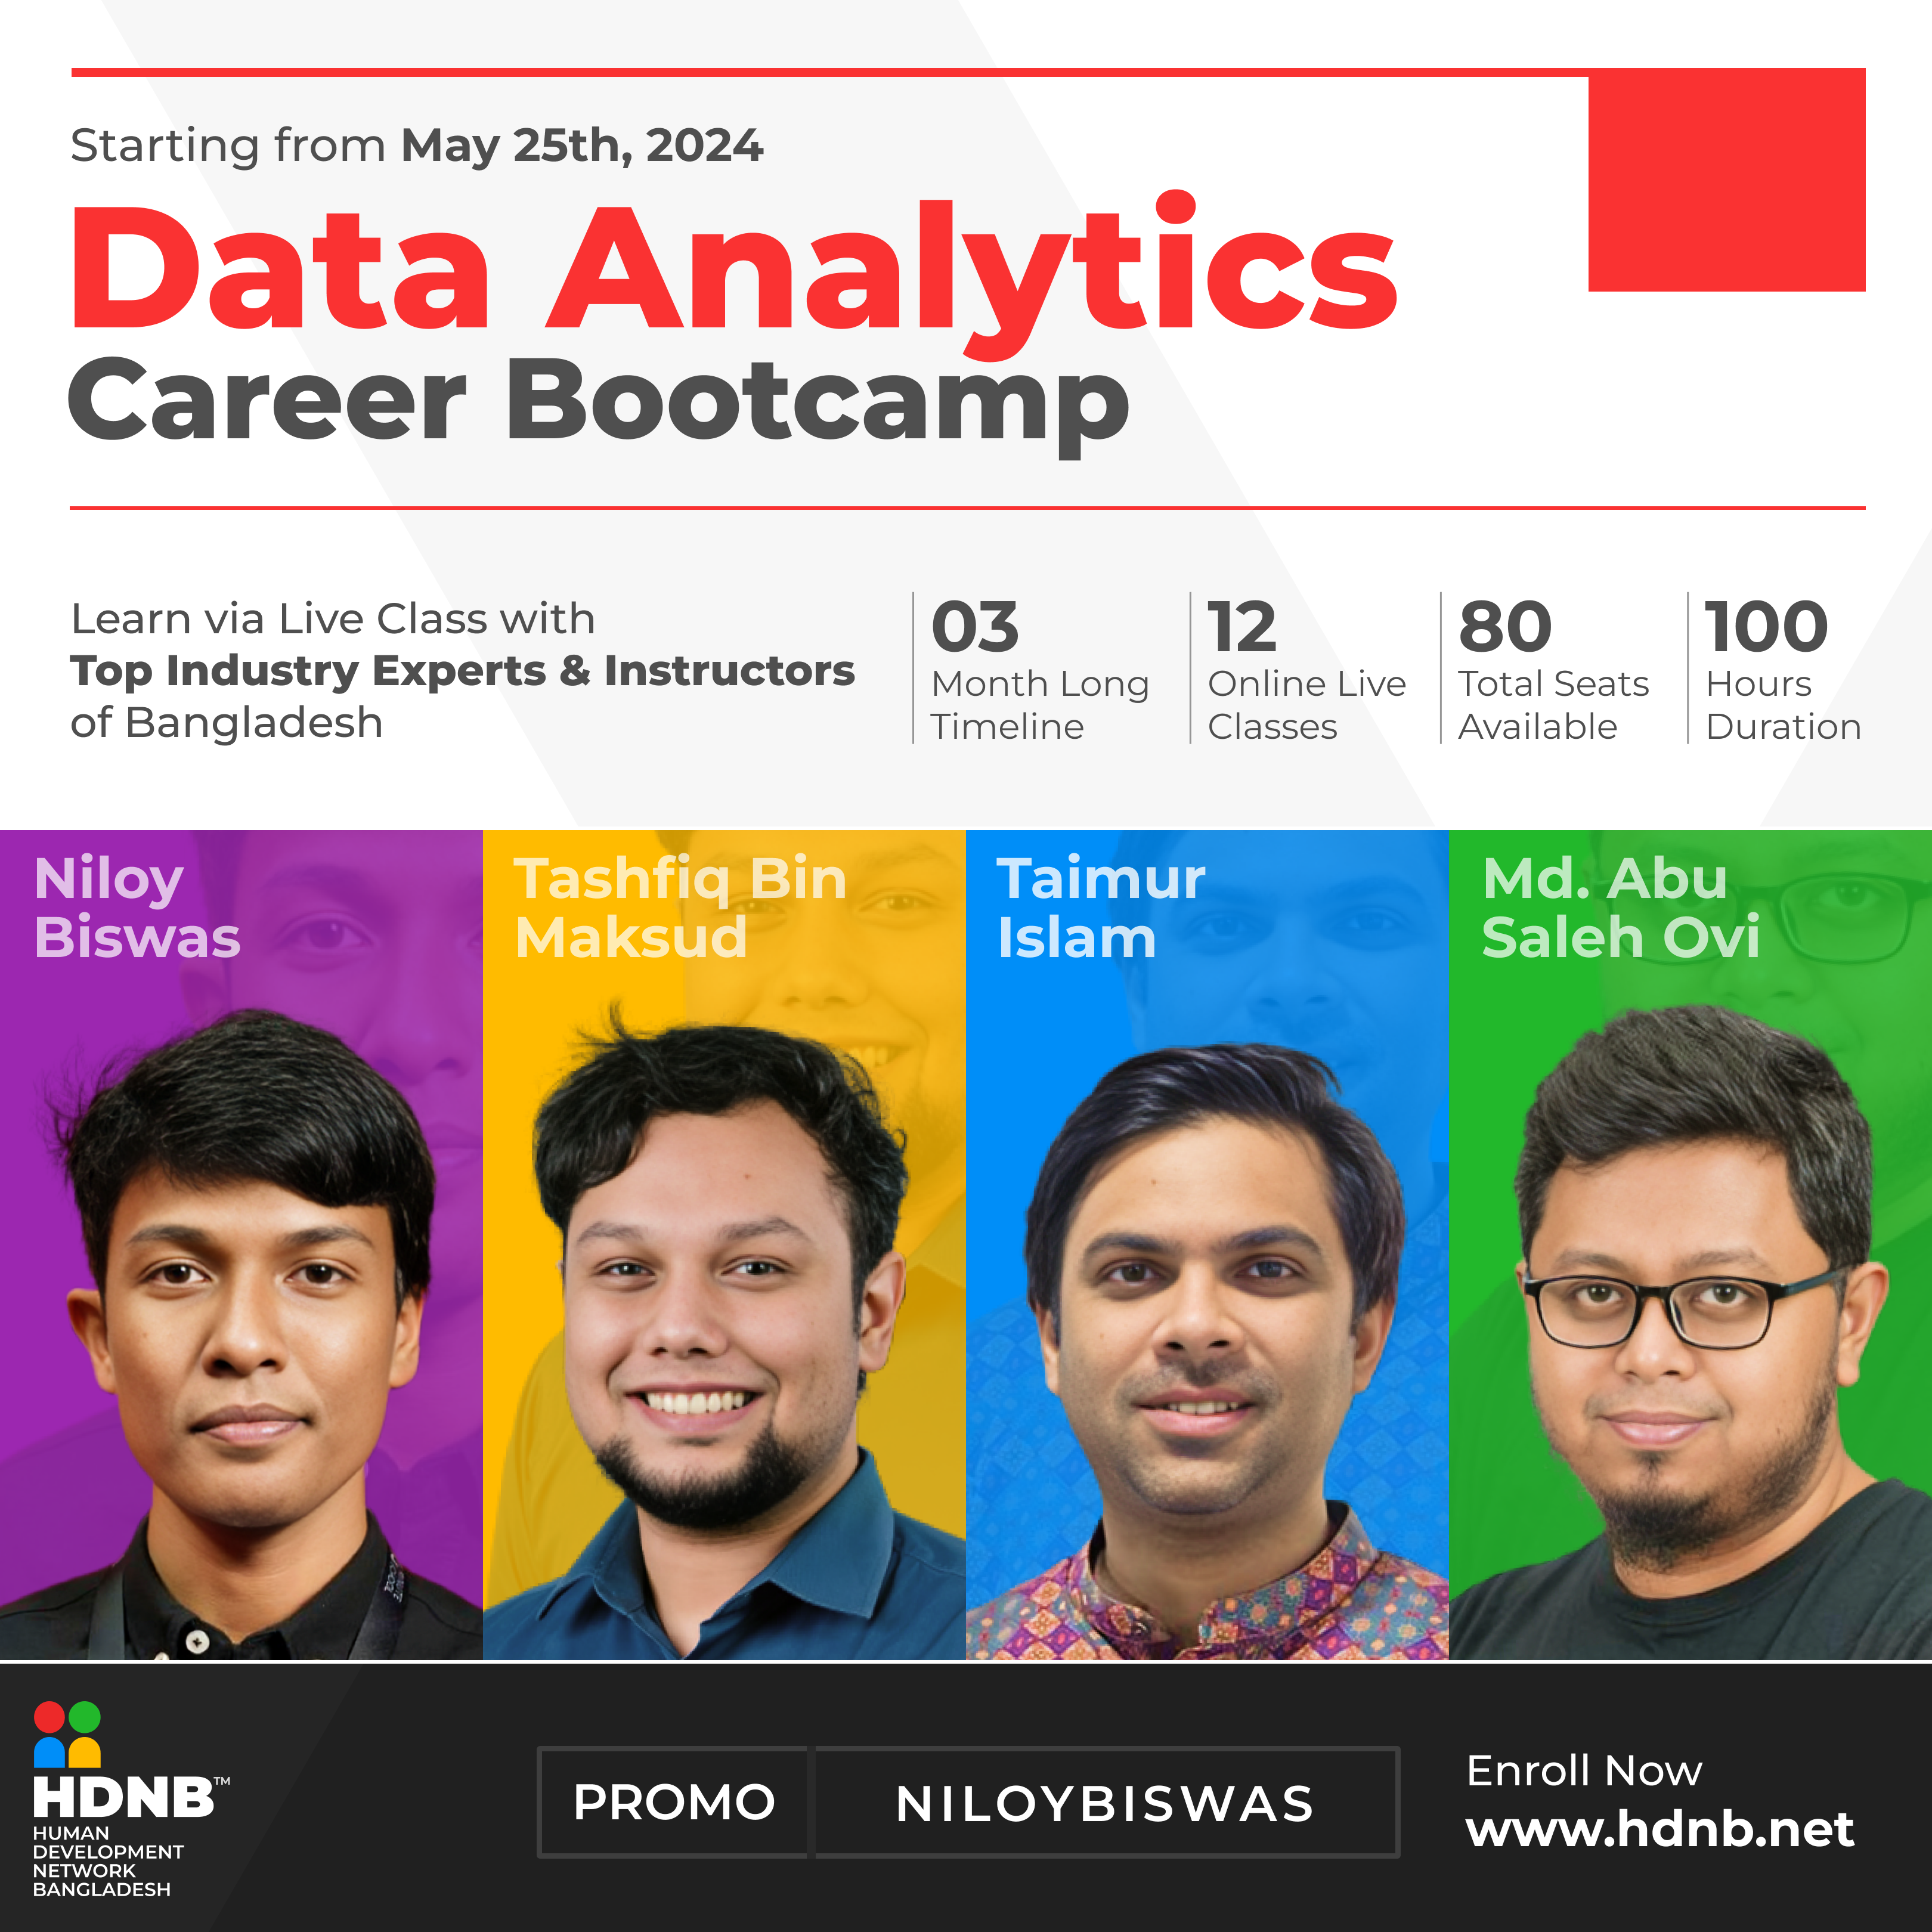
I was an instructor for the Data Analytics Bootcamp, where I taught SQL to aspiring data professionals. My sessions cover a comprehensive range of topics including:
I am dedicated to transforming education and empowering individuals to reach their full potential. My goal is to ensure that participants not only understand the theoretical aspects of SQL but also gain hands-on experience to tackle real-world data challenges.
Looking forward to guiding the next generation of data professionals!
Data Science, Analytics & Insights (DSAI) R&D team.
Tools & Technology used - Python, AWS, SQL, Metabase, Amplitude,
Firebase, Play Console, Grafana


    Biswas, N. et al. (2023) “Machine learning-based model to predict heart disease in early stage employing different feature selection techniques,” BioMed Research International, 2023, pp. 1–15.
    Available at: https://doi.org/10.1155/2023/6864343.
A highly-curated archive of machine learning systems, data warehousing pipelines, and analytics suites developed to solve complex commercial scale and operational roadblocks.

Integrated AI study partner — early R&D, retrieval over curriculum content, and product analytics for 10 Minute School.
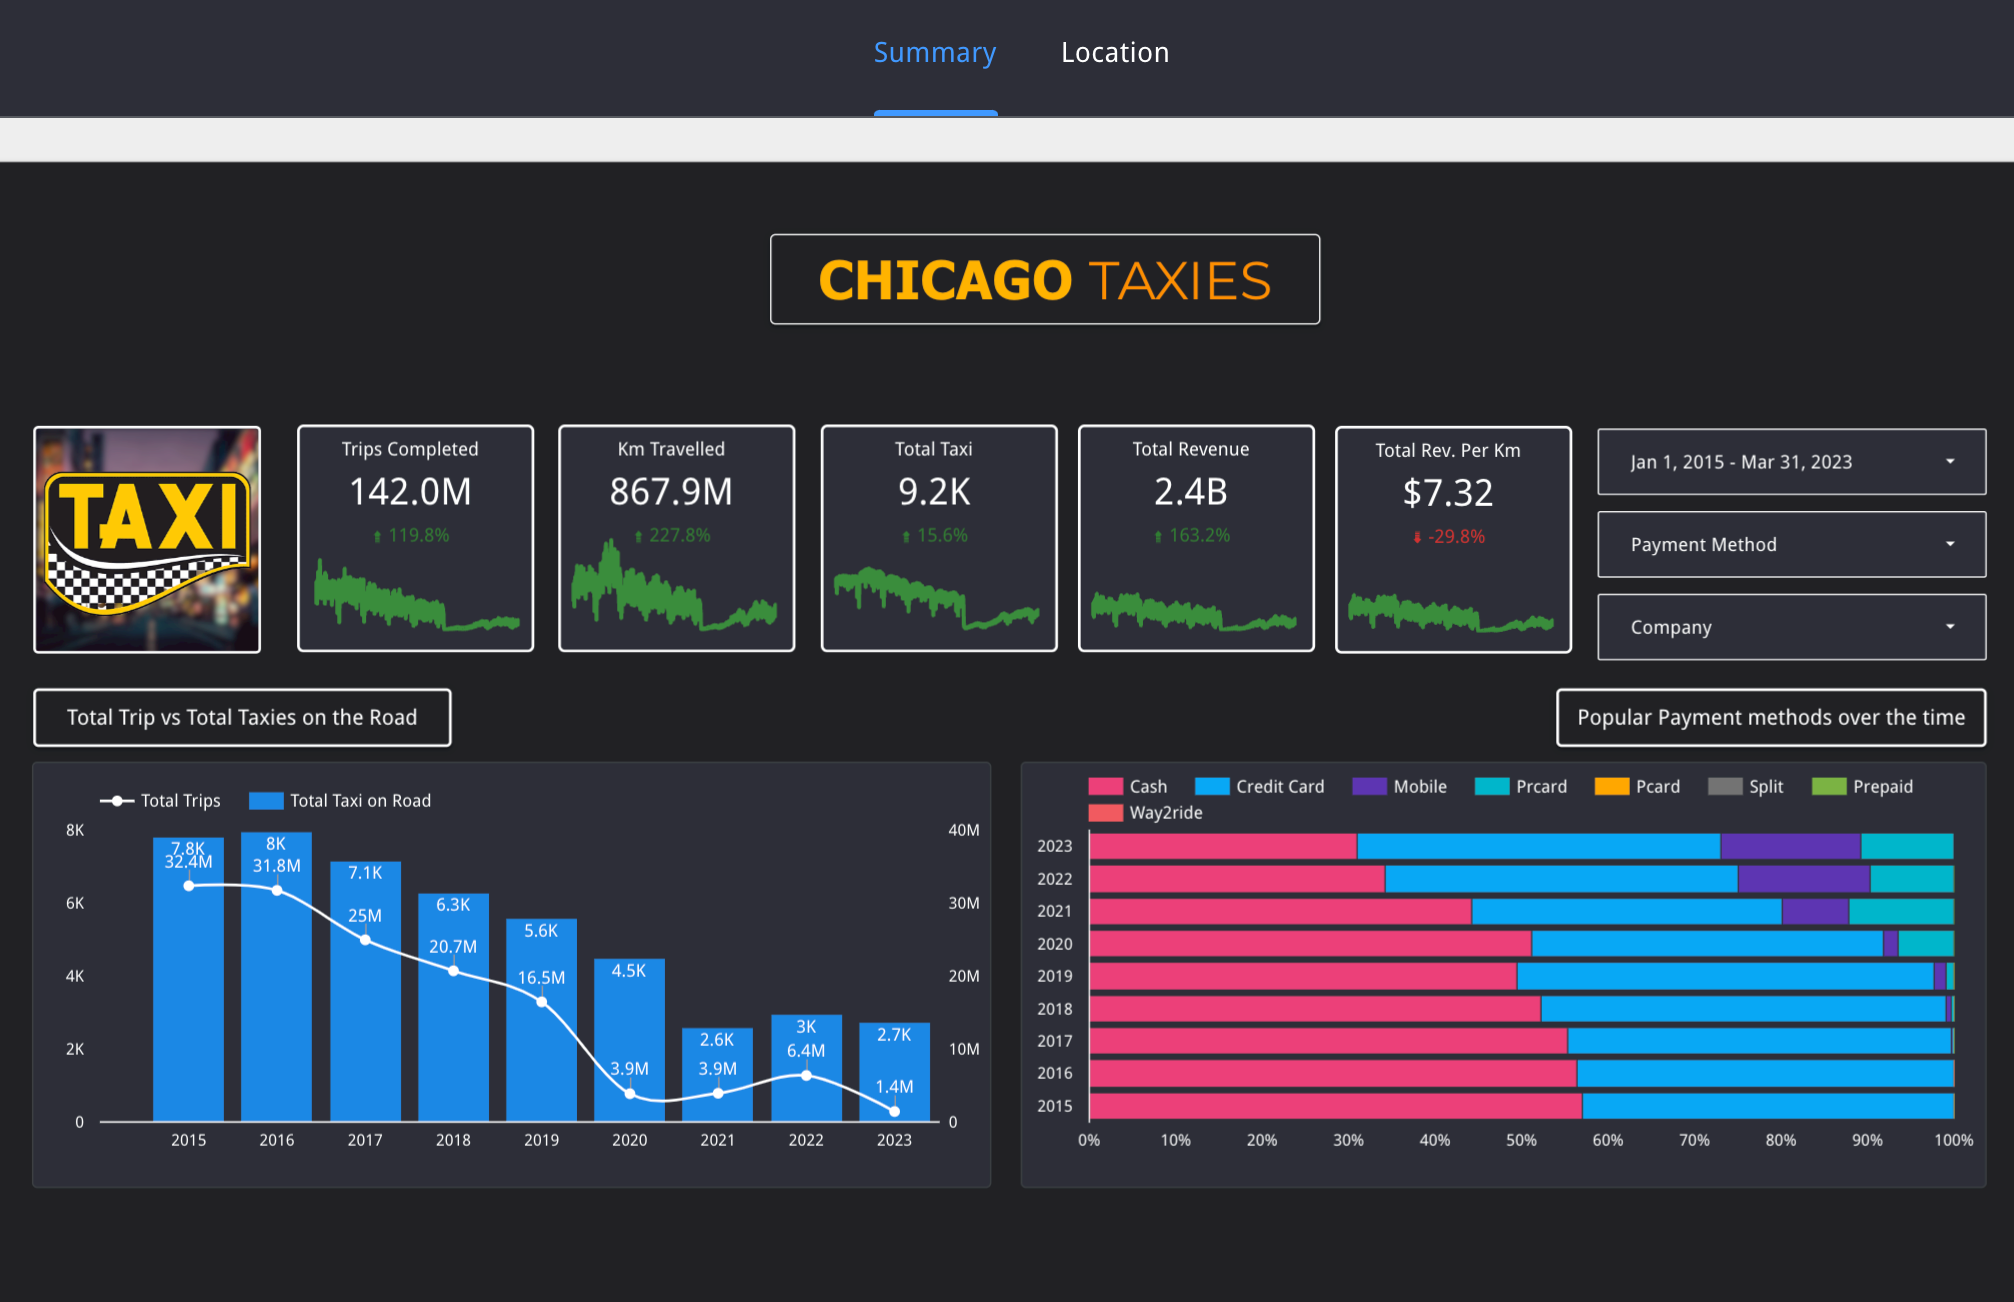
Interactive BI dashboard over large-scale trip data with KPIs for demand, revenue, and route patterns.

Compares classifiers on clinical features to flag cardiovascular risk with interpretable model outputs.
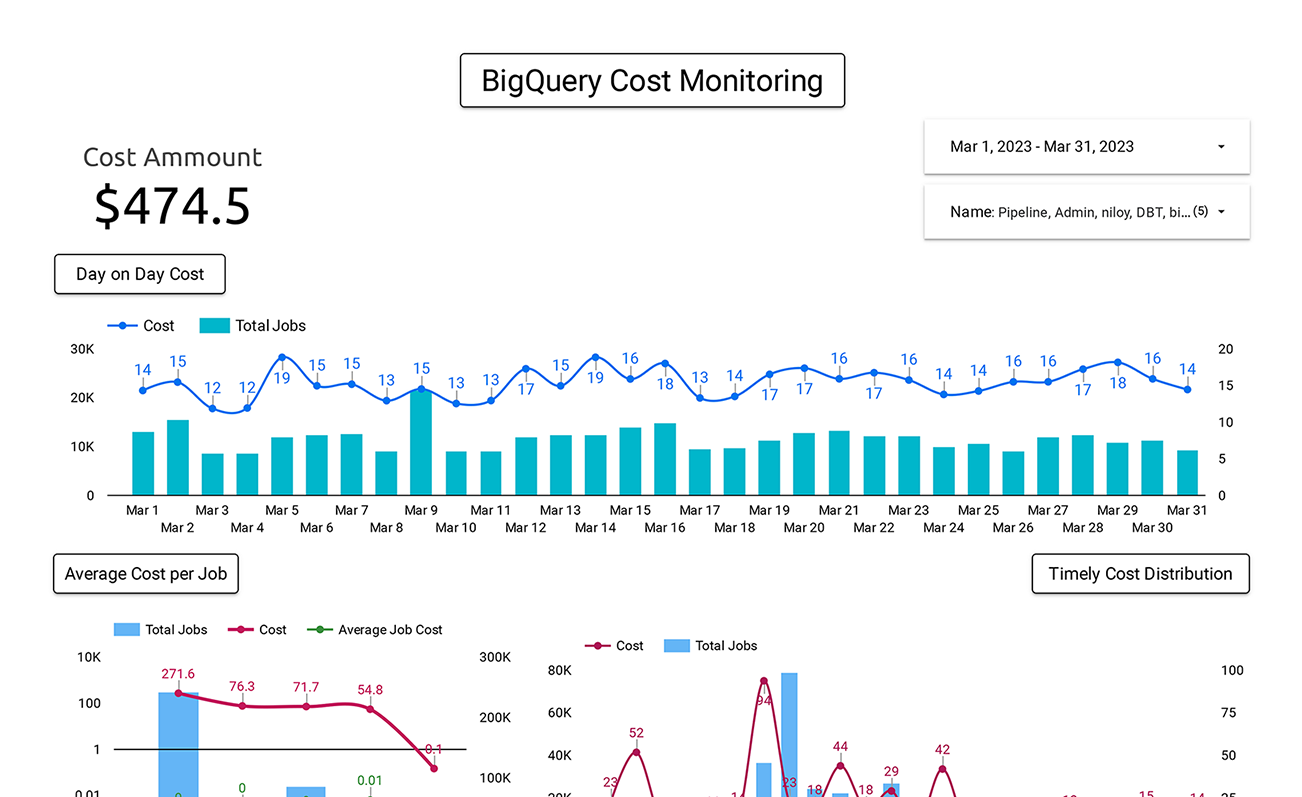
Tracks warehouse spend and query patterns so teams can spot runaway jobs before invoices spike.
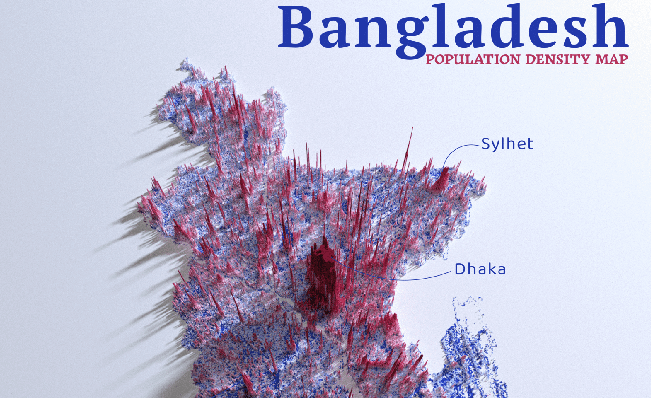
Choropleth and 3D density views across South Asian countries for demographic comparison at a glance.
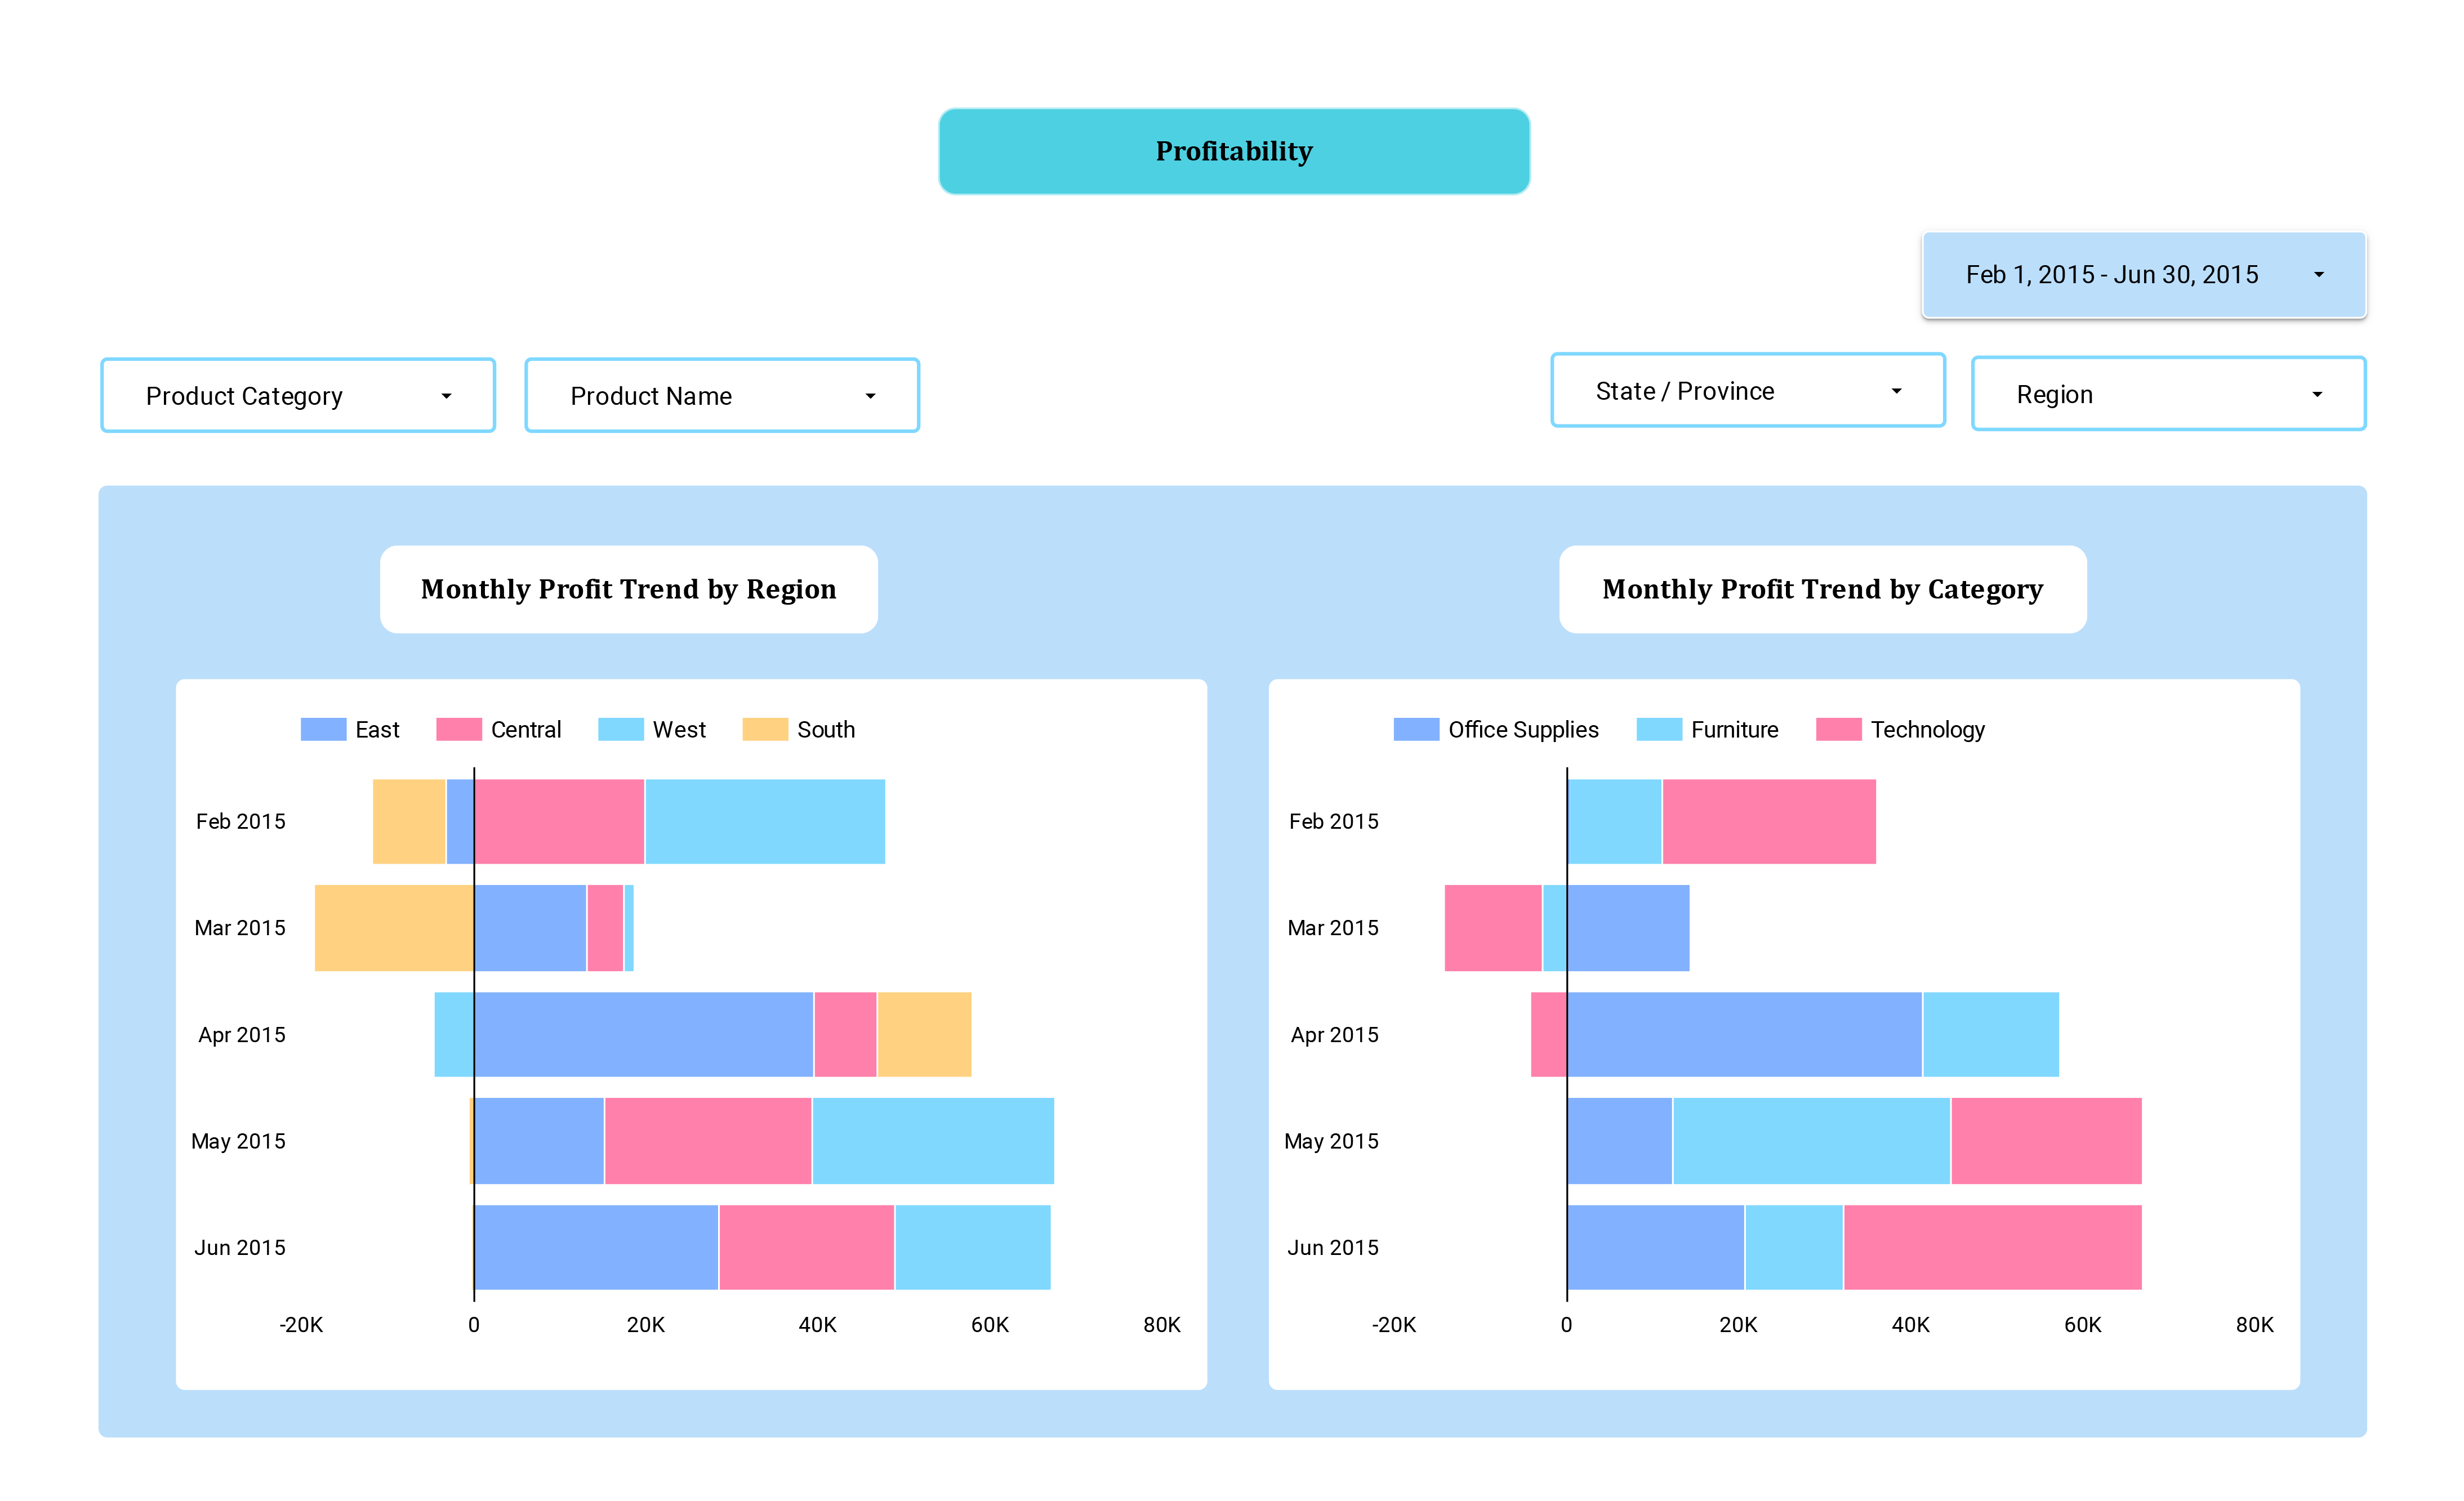
Regional performance, category mix, and profit drivers for a classic retail analytics scenario.
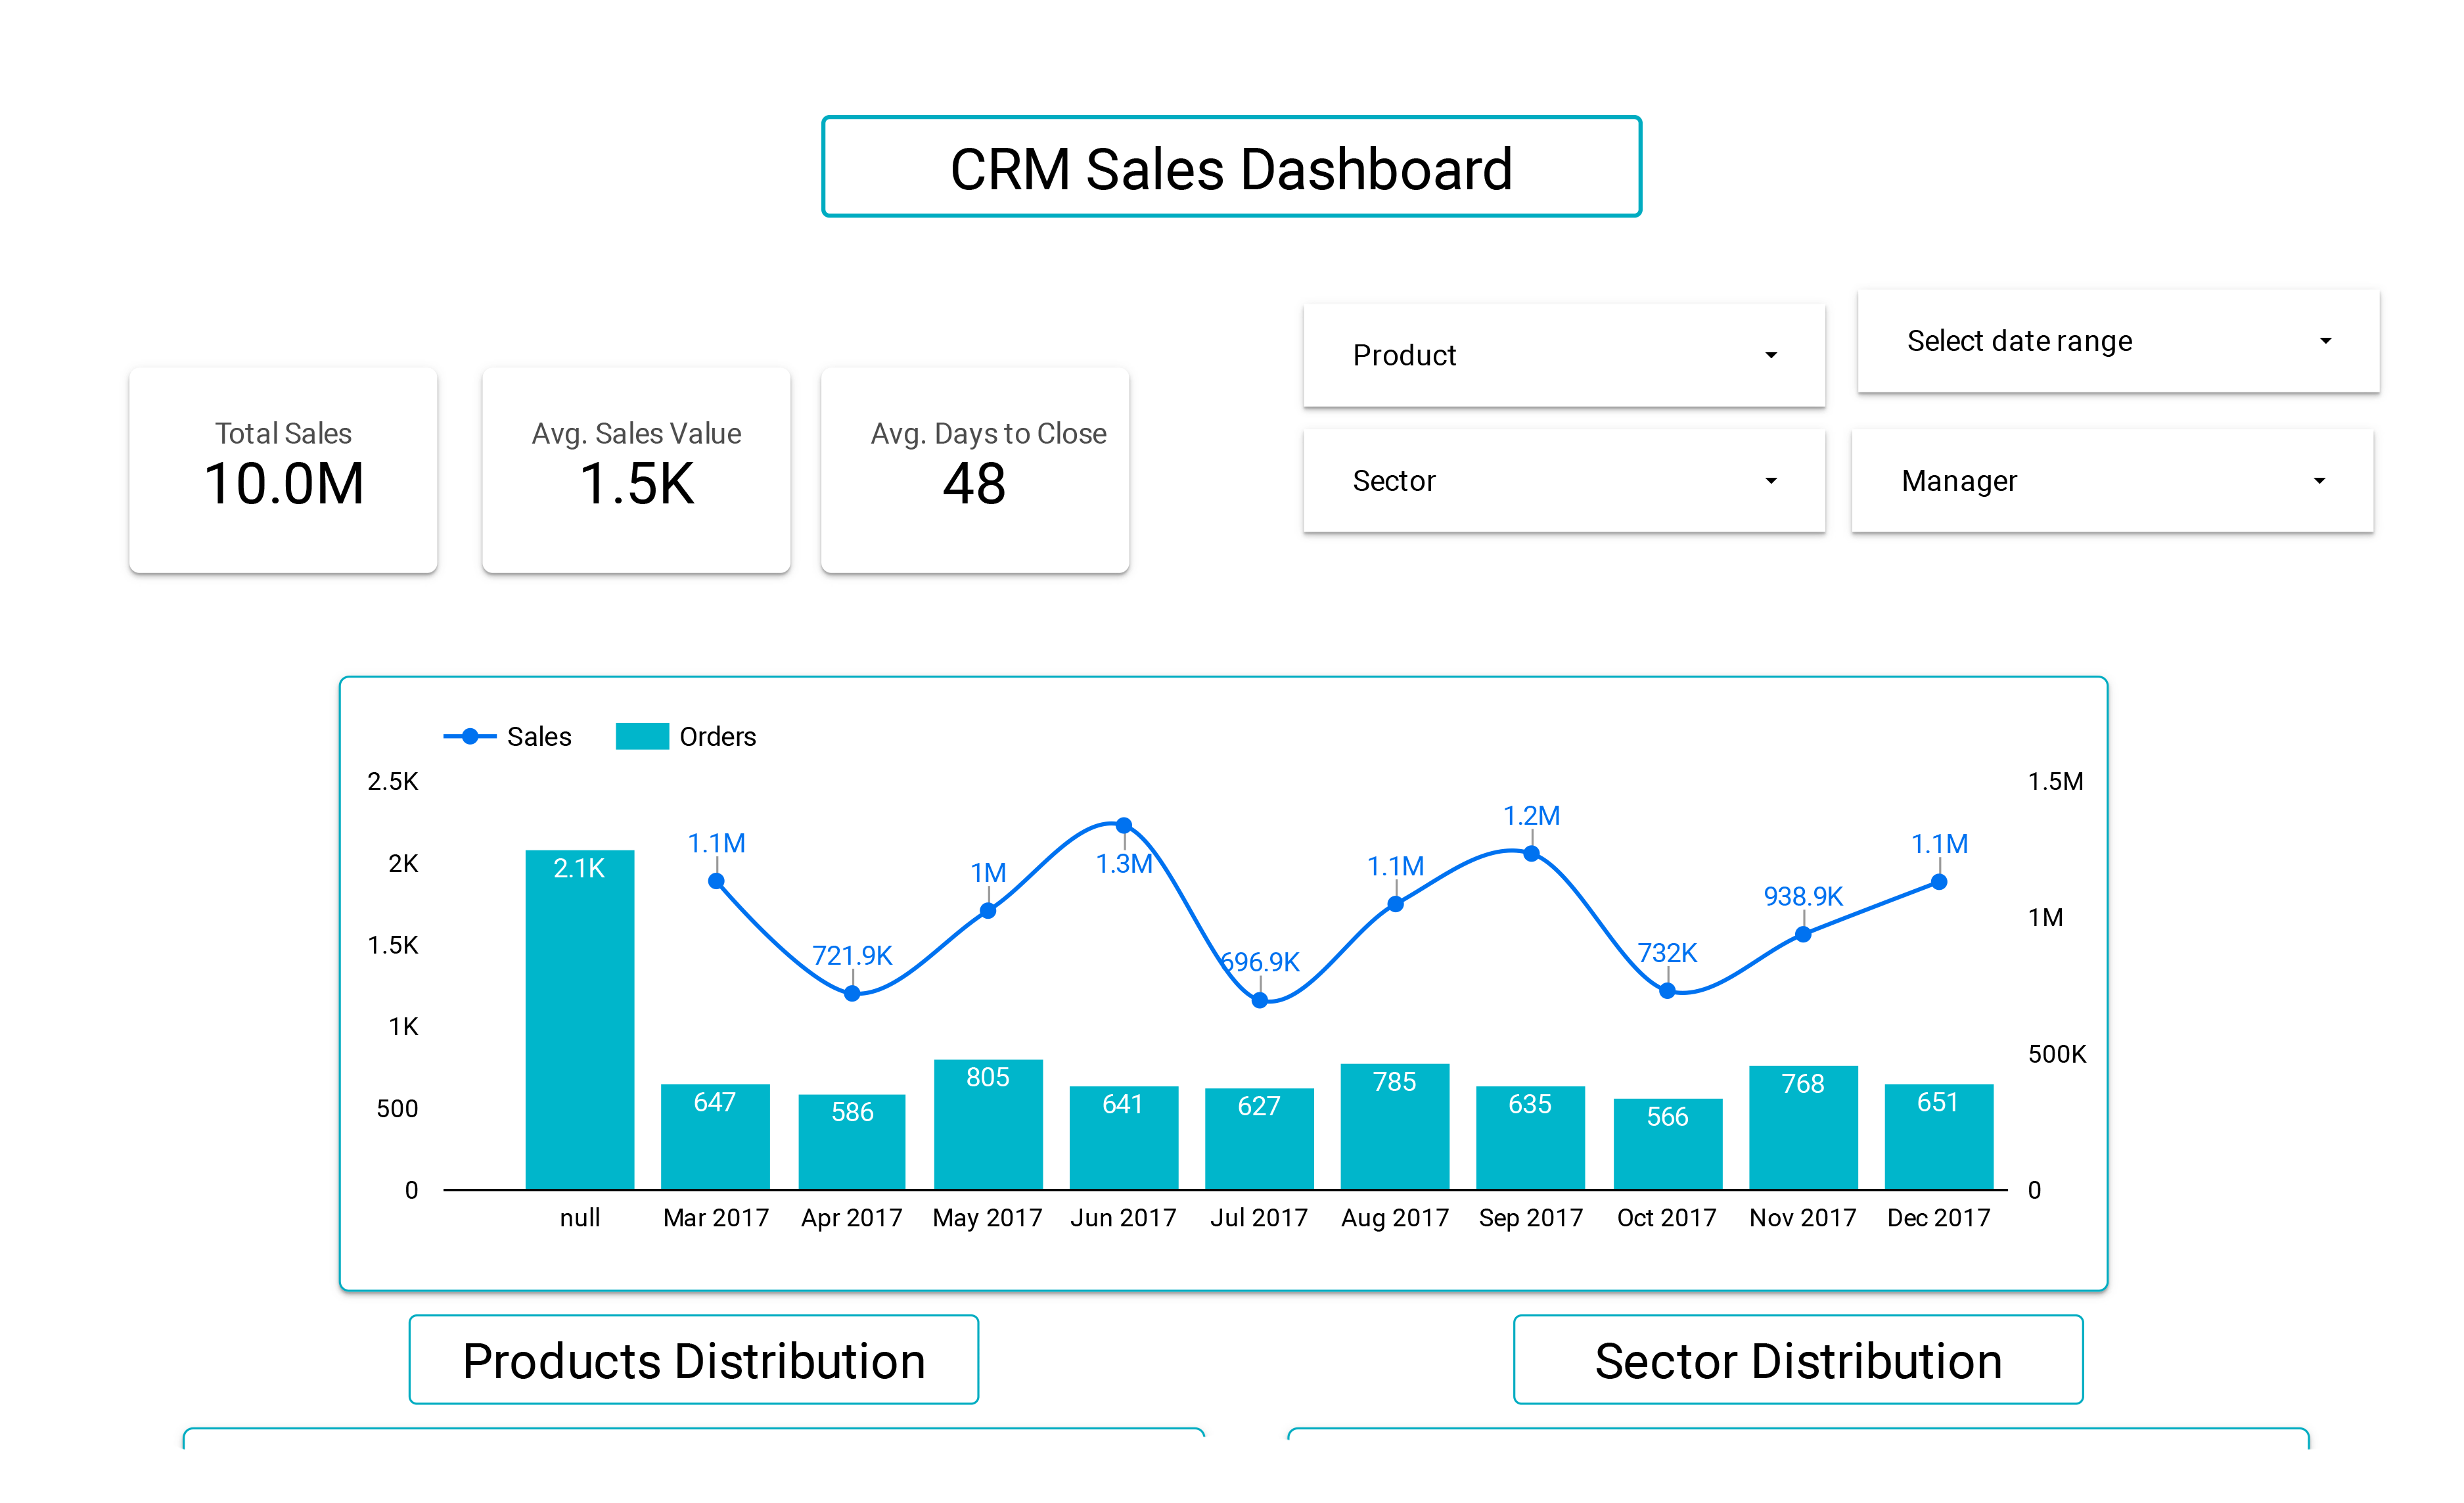
Pipeline health, win rates, and rep-level targets for revenue operations teams.
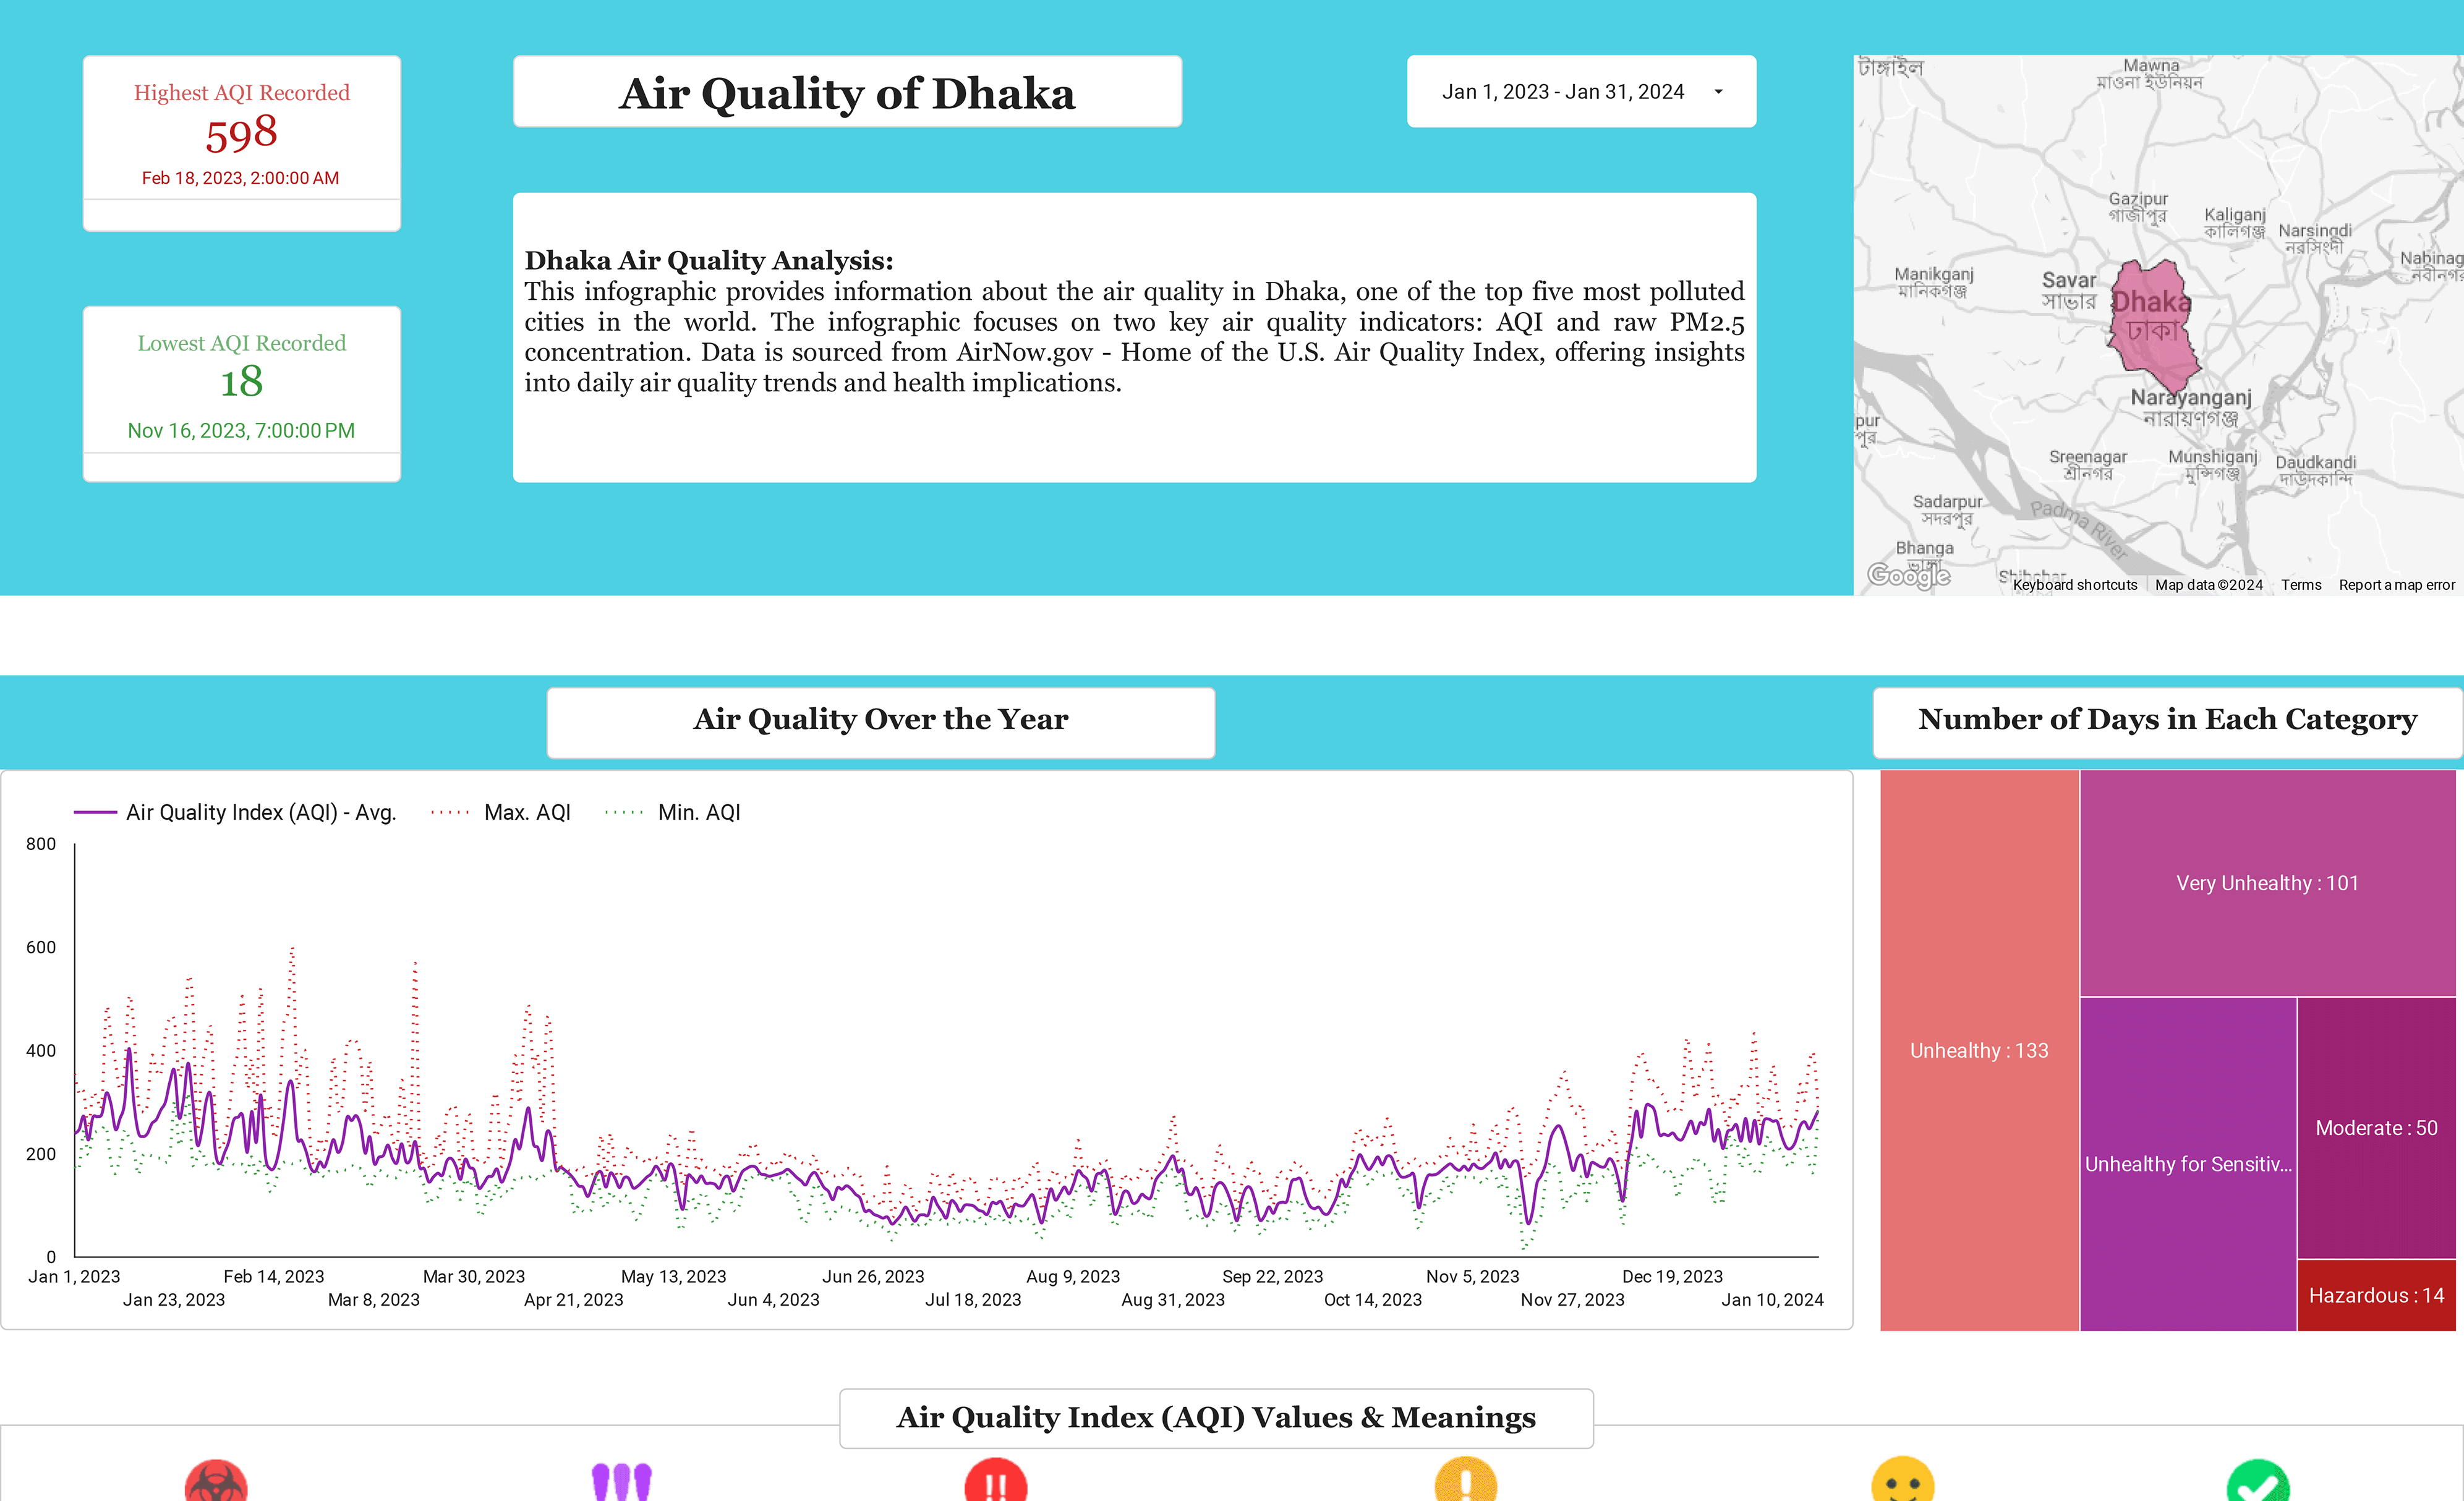
Time-series and geographic views of pollution levels to surface seasonal trends in the capital.
Beyond the data