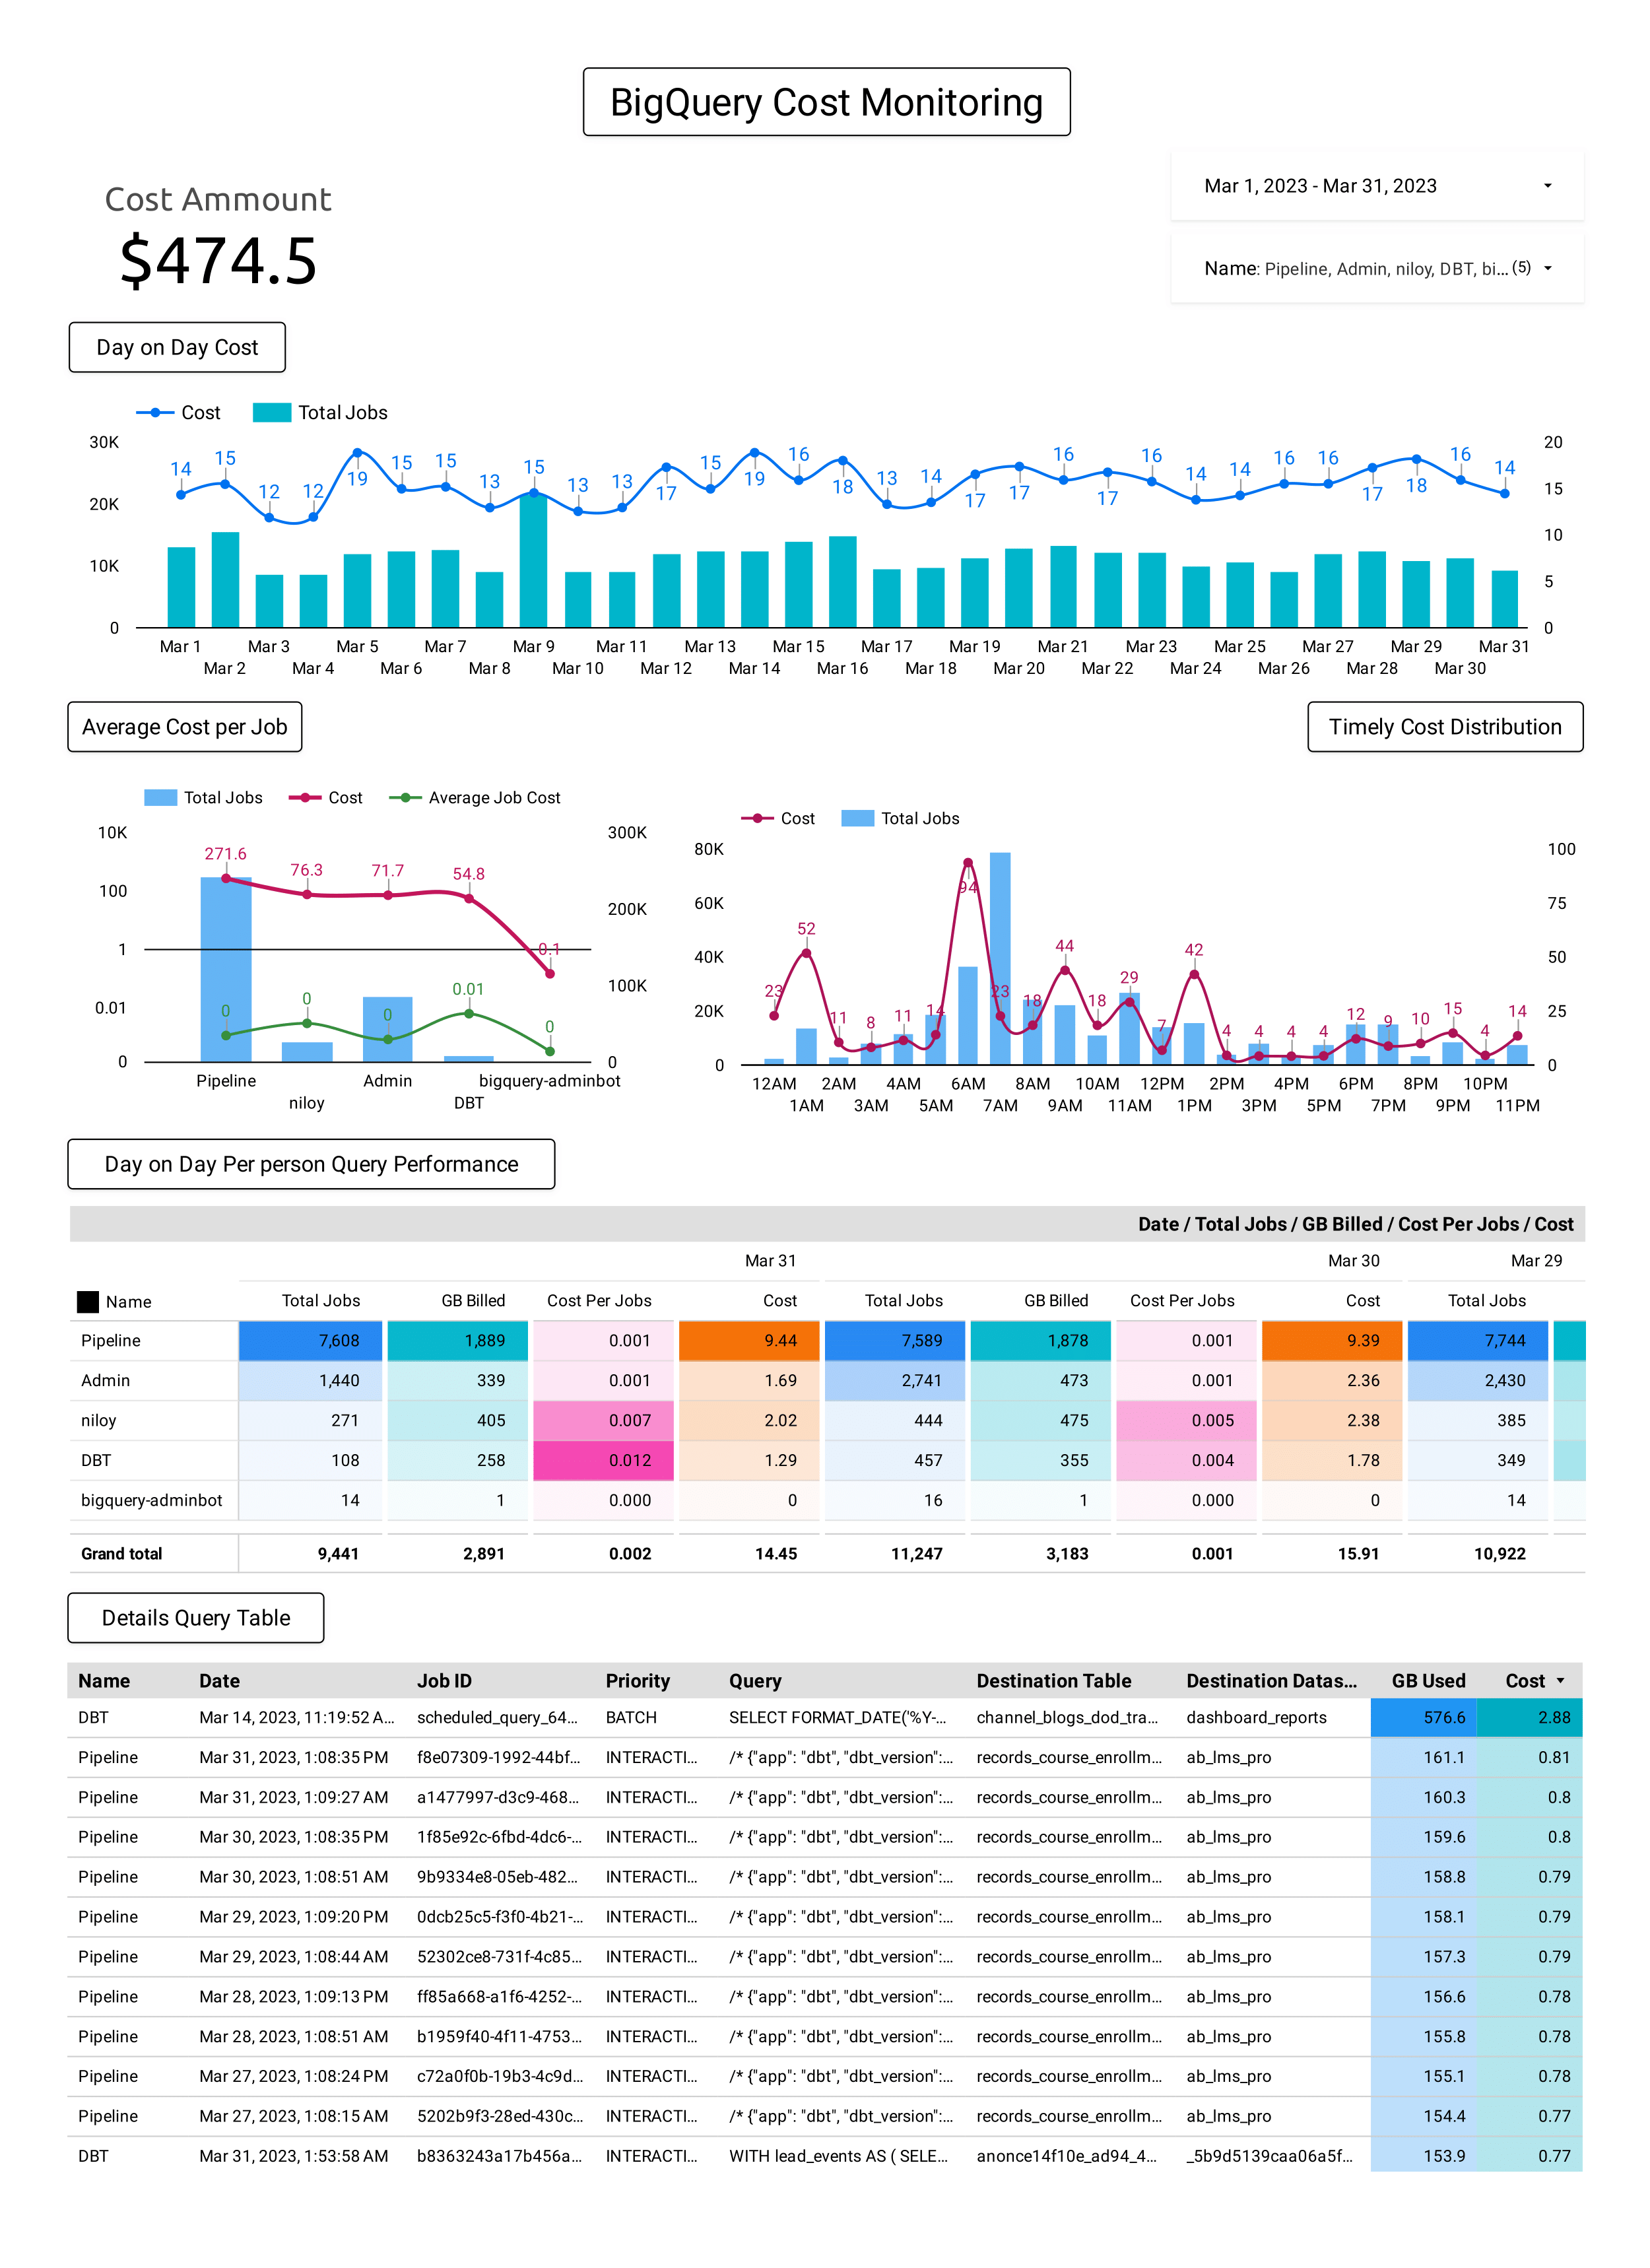
Monitor BigQuery Usage and Costs on GCP with Interactive Visualizations in Looker Studio
Monitoring BigQuery usage and costs is an essential aspect of managing data on Google Cloud
Platform (GCP). BigQuery is a fully-managed, serverless data warehouse that can scale to
petabyte-levels, making it easy to incur significant costs if you’re not careful.
Fortunately, GCP provides several tools and services to help you monitor and optimize your
BigQuery
usage and costs. In this post, we’ll explore how to monitor BigQuery usage and costs using
the Information Schema JOBS table and Visualize the information in Looker Studio for further
Monitoring.
- Data Analytics
- Google BigQuery
- Looker Studio
- SQL
- GCP